By Dave Moenning on Jul 01, 2019 07:51 am
Let's review. The Fed is no longer the enemy. There is, at the very least, a cease-fire in the trade war between China and the good 'ol USofA. Rates are low. Inflation is nowhere to be found. Earnings will likely set a record this year. The U.S. economy continues to chug along. And if one takes a quick look at my Fundamental and Primary Cycle indicator boards, they will find an awful lot of green. As such, the bottom line is investors should probably continue to lean bullish here.
However, this continues to be a hated bull market. It seems all anybody can talk about these days is when the current run for the roses will end. Everybody and their grandmother is looking for the next recession. The next crisis. And the next big, bad, bear that will knock account values down 30-50%.
I get it. Yes, the current bull market, which has not technically experienced a 20% decline in more than a decade (although December's dance to the downside got very close!), will end at some point. I understand that there is a global economic slowdown at work. I see there are headwinds, both real and imagined. And it is true that try as they might, the politicians and global central bankers may not be able to outlaw the business cycle.
So, yes, at some point, one of the longest bull markets on record (although definitely not one of the strongest) will end and the bears will enjoy a year or so in the sun. Thus, an important question for investors, financial advisors, and portfolio managers alike will need to answer is, how do you tell when the bull has run its course.
Or more importantly, how can you tell when the next correction of 10% turns into a 20% move, which then proceeds to become a really big, really bad bear?
How Can You Tell If A Big, Bad Bear is Coming?
There are lots of ideas on the subject, but this morning I'd like to offer up a method based on an old-fashioned concept - earnings.
It is said that earnings are the lifeblood of the stock market. And since the market is purported to be a discounting mechanism of future expectations, if a company's earnings are rising, it follows that the price of the underlying stock should rise as well. And vice versa.
So, it would be logical to assume that if earnings on the S&P 500 began to fall, the risks of a meaningful correction would increase. And if earnings on the S&P fell a lot, it would follow that the risks of a really big, really bad bear market would also rise.
While this concept makes loads of sense (well, to me anyway), a career in this business will teach you that logic doesn't always work when dealing with major turns in the stock market. But the good news is that for the last thirty years, directional changes in the level of S&P 500 EPS has indeed been a pretty decent predictor of nastiness in the stock market.
One Answer: Watch Earnings
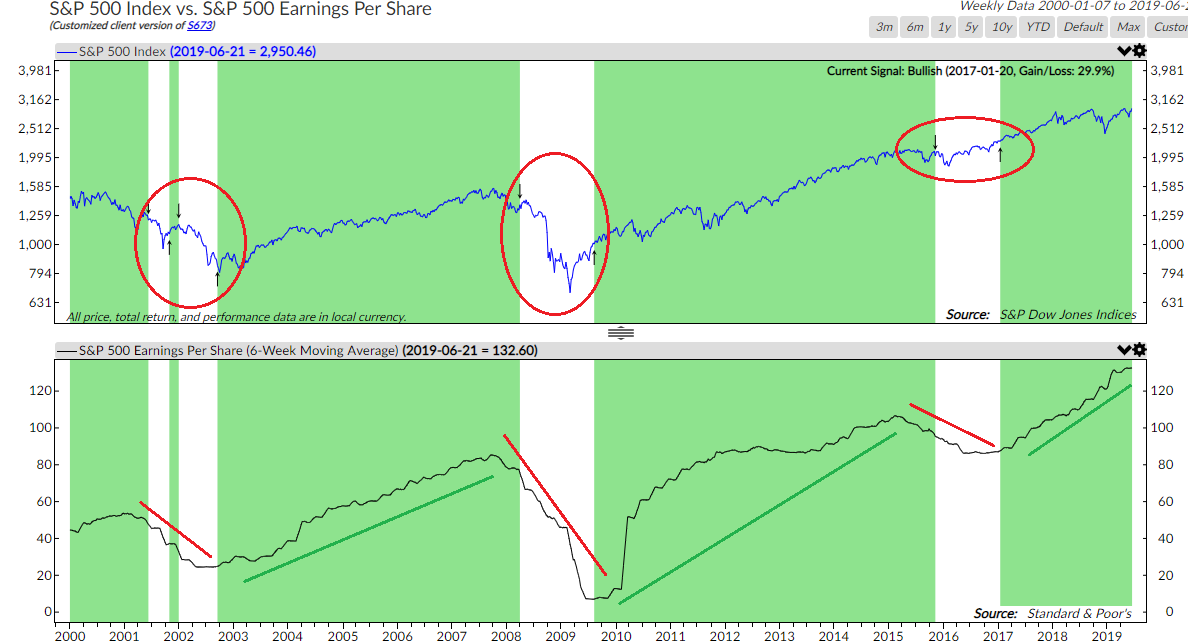
Here's the way the idea works. Start with a 6-week moving average of S&P 500 earnings per share. Next, pay attention to when the moving average falls from its most recent peak by 10%. According to the analysts at Ned Davis Research, this has been a good indicator of potential problems for the overall market.
The chart below illustrates the idea. I've gone back to 2000 and circled in red the times when S&P earnings have fallen by 10% or more.
As you can see, this concept would have done a very nice job in keeping you out of harm's way during the dark days of 2001 and 2002, the 2008-09 financial crisis, and then again, when things got sloppy in late 2015.
One could quibble with the 2015 signal and suggest that the mini bear that ensued wasn't worth trying to sidestep. However, we should remember that during this period it was the debacle in oil. The dramatic decline in the oil patch hit the sector's earnings so hard that it wound up spilling over into the index, which, in turn, caused the so-called earnings recession.
To be sure, no indicator/model is ever perfect. So, the 2015-16 period was an example of a "yea-but" for this particular indicator.
However, the computers at NDR show that a hypothetical test of this approach would have worked pretty well over the last thirty years. For example, since 1990, NDR tells us that when this earnings signal was positive, the S&P 500 gained at an annualized rate of +12.2% per year. And when the indicator was negative, the S&P lost ground at a rate of -12.1% per year.
In my book, this is a performance spread that is worth paying attention to!
So, the question you might be asking is, what is this indicator saying now? Well, given that the 6-week average of S&P 500 EPS is sitting at an all-time high, the indicator is a LONG way from a sell signal. And from my seat, this means that unless something occurs to cause earnings to fall rapidly, investors, financial advisors, and portfolio managers alike might want to continue to stay seated on the bull train.
Weekly Market Model Review
Now let's turn to the weekly review of my favorite indicators and market models...
The State of My Favorite Big-Picture Market Models
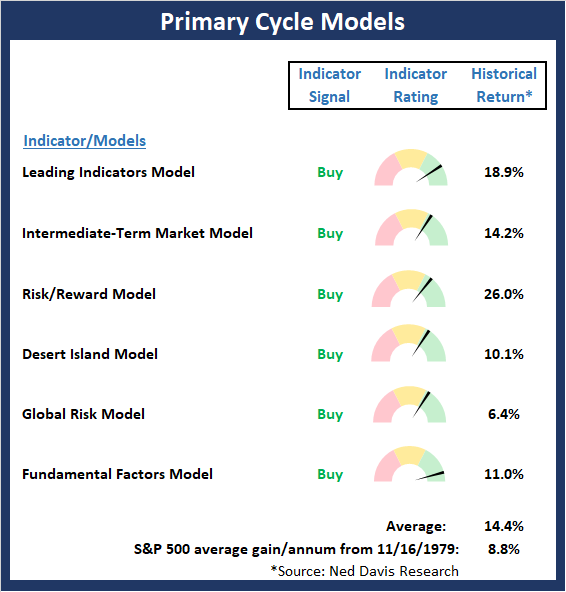
As I wrote last week, there can be little argument that this remains a news-driven environment. I also noted that there isn't an effective way to effectively "model" this type of environment. Yet at the same time, I believe that the big-picture "backdrop" provides a clue about what to expect when the news driven environment ends. And with two models on the Primary Cycle board moving to positive readings, my takeaway is to lean bullish through all the noise.
This week's mean percentage score of my 6 favorite models improved to 73.5% from 62.9% last week (Prior readings: 65.4%, 62.9%, 60%, 60%, 72.5%, 81.1%) while the median also rose to 68.5% versus 66.3% last week (Prior readings: 71.3%, 68.8%, 62.5%, 62.5%, 80.0% 82.5%, 86.7%).
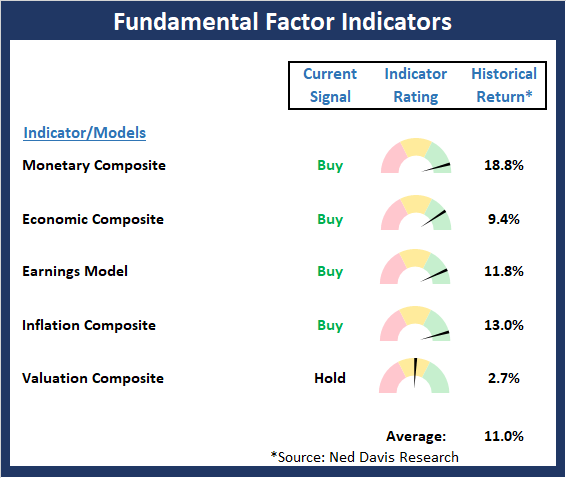
The State of the Fundamental Backdrop
I believe the message from the Fundamental and Primary Cycle boards is to give the bulls the benefit of any doubt and to buy the inevitable dips.
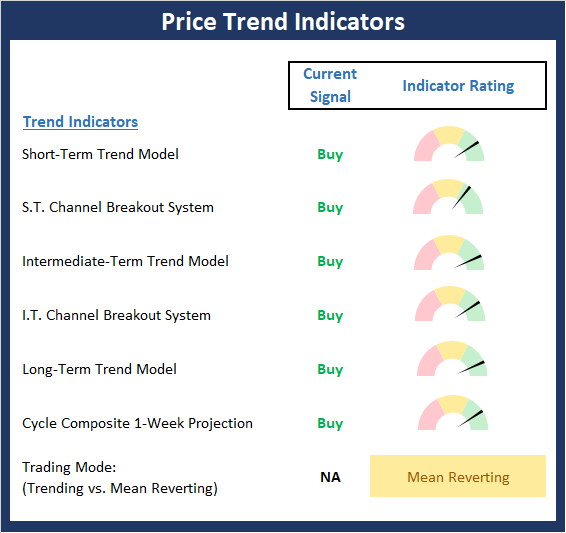
The State of the Trend
Although the major indices moved sideways last week, nothing changed in terms of our view on the overall trend, which is in pretty good shape. Sure, a surprise on the news front could certainly cause traders to explore the current range. However, we continue to believe that the dips should be bought for the time being.
The State of Internal Momentum
The Momentum board continues to sport a lot of green signals. However, I would not label the current momentum environment as super strong. No, most of the intermediate- and longer-term readings are "just okay" at this point in the game. Which, again, tells us to lean bullish and to be ready for pullbacks.
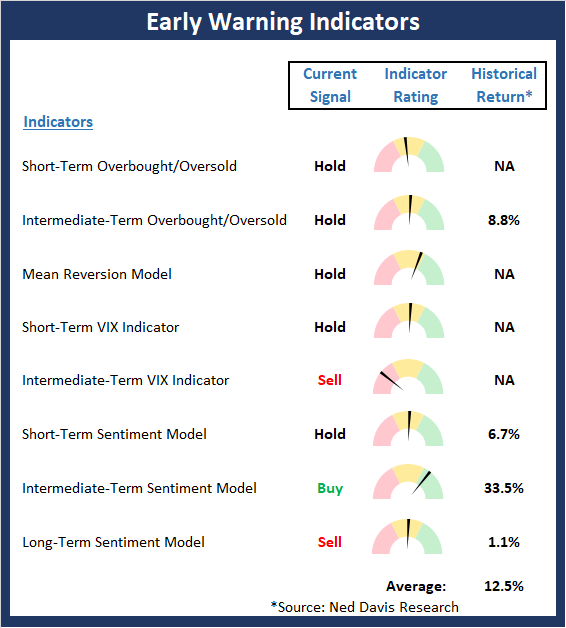
The State of the "Trade"
The Early Warning board is largely neutral at this time with neither team holding much of an edge. In this environment, I've found it best to stay with the prevailing trend but as I've been saying today, be ready for the next pullback.
Thought For The Day:
The quieter you become, the more you can hear. Ram Dass
Wishing you green screens and all the best for a great day,
| 
No comments:
Post a Comment