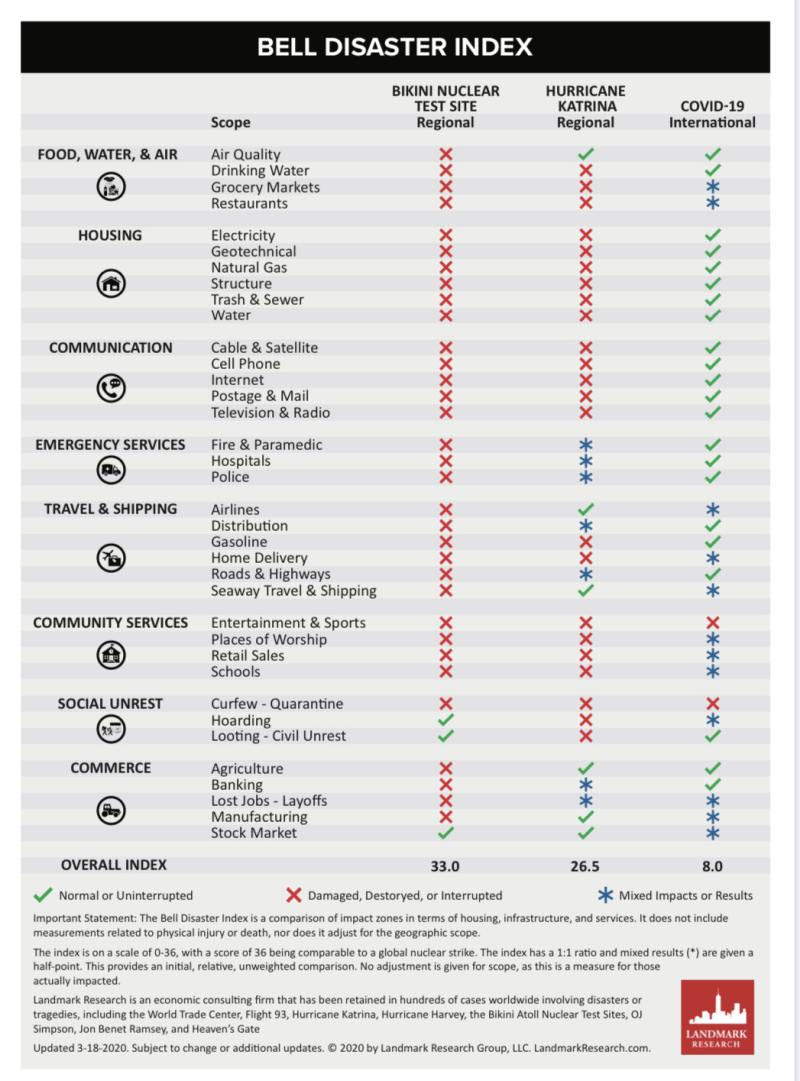
And for the glass half-full perspective, I submit this graphic, also provided today by Barry Ritholtz, of a very telling chart of the so-called Bell Disaster Index. As the chart clearly shows, compared to other major disasters, notably Hurricane Katrina and the infamous Bikini Nuclear Test Site, this one is more benign, with most of the infrastructure problems that were so battered by the other disasters remaining largely unaffected by this one. Curiously, the death toll is not included in this chart, which for this international disaster would be off the charts compared to both Katrina and Bikini. But at least it's a little bit of sunlight on this otherwise very bleak crisis.
Succinct Summations of Week’s Events 3.3.20
Succinct Summations for the week ending April 3rd, 2020
Positives:
1. 90% of the US is now under Shelter-in-Place orders, which should reduce the rate of infections and “flatten the curve;”
2. Pending home sales rose 2.4% m/o/m, above the expectations.
3. Home mortgage refinance apps rose 26.0%.
4. Home mortgage apps fell 11.0% w/o/w.
5. International trade gap narrowed from $-45.5B to $-39.9B in March.
6. PMI Mfg Index came in at 48.5 for March, above expectations.
7. ISM Non-Mfg Index came in at 52.5 for March, above expectations.
Negatives:
1. An inept White House continues to bumble the pandemic response, needlessly causing a US mortality result that will likely number in 100s of thousands.
2. Nonfarm payrolls fell 701k in March — worst since 2009.
3. Jobless claims rose to 6.648M.
4. Unemployment rate rose to 4.4% from the previous 3.9%.
5. Private payrolls came in at -27k, below the previous 179k.
6. Challenger Job Cut report has layoffs at 222,288 for March.
7. Construction spending fell 1.3% m/o/m, below expectations.

No comments:
Post a Comment